Why Two Gene Discovery Methods Found Completely Different Genes (And Why That Matters for Your Health)
Two different approaches to finding disease genes analyzed the same dataset from 500,000 people and came back with complementary results. GWAS identified one set of genes as important, while burden tests flagged an entirely different set. Neither method was wrong. Yet they're used to select drug targets that succeed or fail.
This divergence reveals something uncomfortable about how we prioritize genes for disease research and drug development: our rankings are influenced as much by gene structure and chance as they are by true biological importance. Understanding these invisible biases changes what confidence we should place in genetic discoveries.
Let me show you what's actually driving these gene rankings.
The Problem: Why Method Matters More Than You'd Think
When researchers launched the first genome-wide association studies in the late 2000s, they expected to find disease genes by looking for statistical associations between genetic variants and traits. The idea was elegant: if a genetic variant correlates with disease in thousands of people, it probably affects that disease.
But here's what they didn't anticipate. Two different statistical approaches to finding disease genes using the same people with the same genotypes can identify almost entirely different genes as most important.
Consider this: in a recent analysis of 209 traits from the UK Biobank, GWAS and rare variant burden tests disagreed substantially on gene rankings. GWAS flagged certain genes as top candidates. Burden tests flagged different genes as top candidates. The overlap was smaller than you'd expect if they were measuring the same underlying biology.
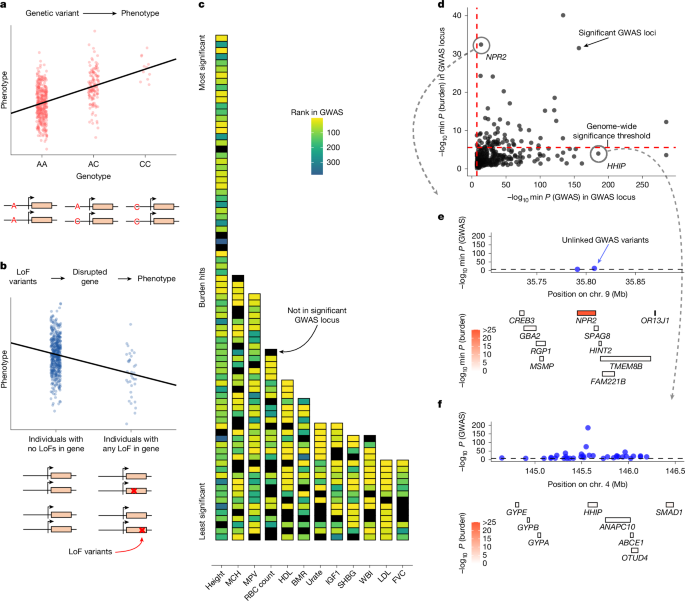 Source: Sayer et al., "Specificity, length and luck drive gene rankings in association studies," Nature (2025). Link
This isn't a failure of methodology. Both methods are statistically sound. Both produce statistically significant associations. Yet they highlight completely different genes as important. Why?
A 2025 Nature paper by Sayer and colleagues at the Mostafavi Lab answers this by examining three trait-irrelevant factors that systematically influence gene rankings in association studies: gene length, trait specificity, and luck. Understanding these factors changes how you should interpret genetic discoveries.
The Framework: What Actually Drives Gene Importance?
Before diving into the three factors, let's establish the framework for thinking about gene importance. Genes matter in two distinct ways:
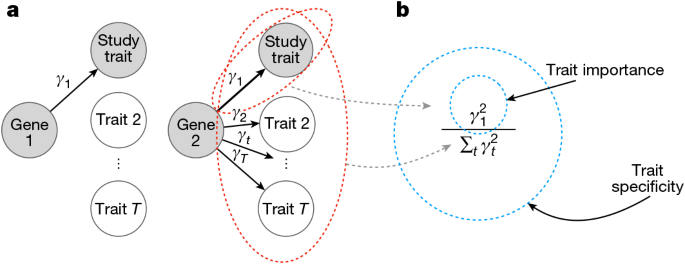
Trait Importance: The effect size. How much does a gene quantitatively influence a trait? A gene that strongly affects cholesterol levels has higher trait importance than a gene with a tiny effect.
Trait Specificity: The focus. Does a gene primarily affect a single trait, or does it affect dozens of phenotypes? A gene that specifically increases diabetes risk but doesn't affect height, weight, or a dozen other traits is trait-specific. A gene that affects multiple diseases is pleiotropic, meaning it has low trait specificity.
These two dimensions aren't the same. A gene can have large effects while being highly pleiotropic. Another gene might have small effects but be exquisitely specific to one trait. Current gene ranking methods blur these distinctions.
 Source: Sayer et al., Nature (2025). Link
Factor 1: Gene Length Bias
Here's a simple statistical fact that profoundly affects gene discovery: longer genes have more DNA.
More DNA means more potential positions where a SNP (single nucleotide polymorphism) could sit. More SNPs in a gene means more "opportunities" for at least one to reach statistical significance, purely by random variation.
Think of it like buying lottery tickets. Someone buying 1,000 tickets is more likely to win than someone buying one ticket. Not because their tickets are better. Just because they have more of them. In GWAS, longer genes get more lottery tickets.
Consider two hypothetical genes affecting the same trait with identical true effect sizes:
- Gene A: 10 kilobases long, 50 SNPs tested in GWAS
- Gene B: 100 kilobases long, 500 SNPs tested in GWAS
At any statistical threshold, Gene B has roughly ten times more "chances" to exceed that threshold. If you're testing 50 SNPs versus 500 SNPs with the same true effect, the longer gene wins more often, even though both genes have identical causal importance.
This isn't subtle. The average human gene spans 27,000 base pairs, but the range is enormous. Some genes are 2,000 base pairs. Others exceed 2 million base pairs. That's a thousand-fold difference. The titin gene (TTN), associated with muscle traits, sprawls across 300,000 base pairs. Meanwhile, the SEMA3D gene is only 35,000 base pairs.
In GWAS, this creates a systematic advantage for longer genes. A longer gene is more likely to have a variant that exceeds the p < 5×10⁻⁸ threshold, the standard cutoff for "genome-wide significance," purely because it has more SNPs in play. This isn't corrected by multiple testing adjustment. Bonferroni correction applies the same p-value threshold to all SNPs, but it doesn't adjust for the fact that testing more SNPs in a longer gene gives it more chances to win.
The statistical mechanics reveal the depth of this bias. Even with linkage disequilibrium (where nearby variants are correlated), longer genes maintain their advantage. The correlation reduces but doesn't eliminate the extra chances. A 2024 analysis across 305 GWAS tools found that gene length still predicted top rankings even in tools specifically designed to correct for it.
The consequence? Genes ranked highly in GWAS tend to be longer than average. But length isn't a trait-relevant factor. A gene that affects heart disease risk doesn't care whether it spans 10,000 or 100,000 base pairs.
Factor 2: Trait Specificity and the Pleiotropy Problem
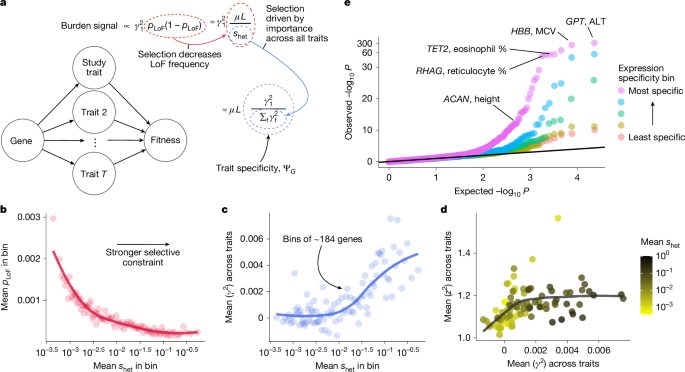
GWAS and burden tests prioritize different genes because they implicitly measure different aspects of genetic architecture: trait specificity.
Some genes are workhorses. They're involved in fundamental cellular processes, so they affect dozens of traits. When you mutate them, multiple things go wrong. These pleiotropic genes show associations with height, weight, intelligence, disease susceptibility, and more. They're genomic jack-of-all-trades.
Other genes are specialists. They're involved in specific biological pathways that affect one trait. Mutations create a focused phenotype.
Here's the critical finding from burden tests: when researchers looked for genes with many rare mutations specifically affecting a single trait, they identified different genes than GWAS did. Burden tests prioritized genes with trait-specific mutations. GWAS prioritized genes associated with trait-specific variants, but in pleiotropic genes.
 Source: Sayer et al., Nature (2025). Link
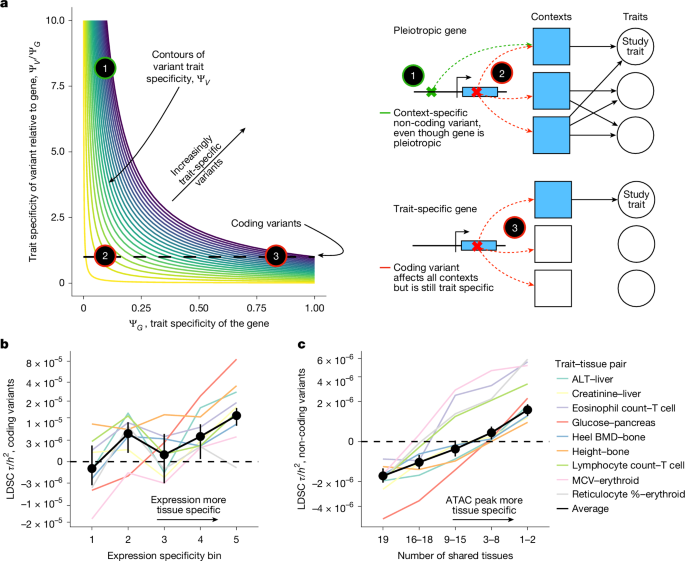
Why does GWAS capture pleiotropic genes? Because non-coding common variants are context-specific. A variant in a regulatory region of a pleiotropic gene might affect the gene's expression specifically in heart tissue. In kidney tissue, it might have no effect. GWAS, which tests for association with a broad trait like "cardiovascular disease risk," catches these context-specific effects in pleiotropic genes.
Burden tests, which aggregate rare mutations within genes, capture a different signal: genes where rare mutations specifically disrupt function relevant to a single trait. These tend to be more trait-specific.
This has profound implications for drug development. A 2020 study analyzing FDA drug approvals found that genes with clear evidence across multiple traits (pleiotropic genes) have lower approval rates than genes with specificity. When you target a pleiotropic gene, you get off-target effects, toxicity concerns, and unclear mechanisms. The approval rate for drugs targeting genes with strong genetic evidence is roughly 2 times higher than baseline, but drugs targeting pleiotropic genes have substantially lower success rates.
 Source: Sayer et al., Nature (2025). Link
GWAS has a systematic bias toward pleiotropic genes. This isn't a flaw in the method. It's a feature that wasn't recognized until recently.
Factor 3: Luck and Random Genetic Drift
The third factor is the hardest to accept: randomness.
Population genetics isn't deterministic. Allele frequencies don't follow mathematical laws exactly; they're influenced by random sampling effects, genetic drift, and chance events in population history. In a sufficiently large sample, drift effects become noticeable.
Consider this: GWAS tests approximately 1 million SNPs. At a significance threshold of p < 5×10⁻⁸, you'd expect about 0.05 false positives by chance. But genetic drift introduces systematic variation. Some populations, through random chance, have allele frequencies that happen to correlate strongly with a trait. Other populations don't.
When you're testing a million variants in a sample of 500,000 people, some fraction of "significant" associations represent genuine signal. But another fraction represents luck; allele frequencies that drifted high or low in this specific sample by chance.
Imagine a genetic variant that genuinely doesn't affect your trait at all. In an infinitely large population, it would show zero association. But in your actual study with a million people, random sampling variation means this variant won't show exactly zero association. Sometimes it will be slightly higher in cases, sometimes slightly lower. Just by chance.
The consequence is that gene rankings include a substantial luck component. A gene might rank highly not because it's truly causal but because its associated variant drifted lucky in this population. Replicate the study in a different population with different drift patterns, and the ranking changes.
This isn't quantifiable from individual studies. You need to replicate across populations to see how much ranking changes due to drift versus true effect. But it's a real factor that influences which genes get prioritized.
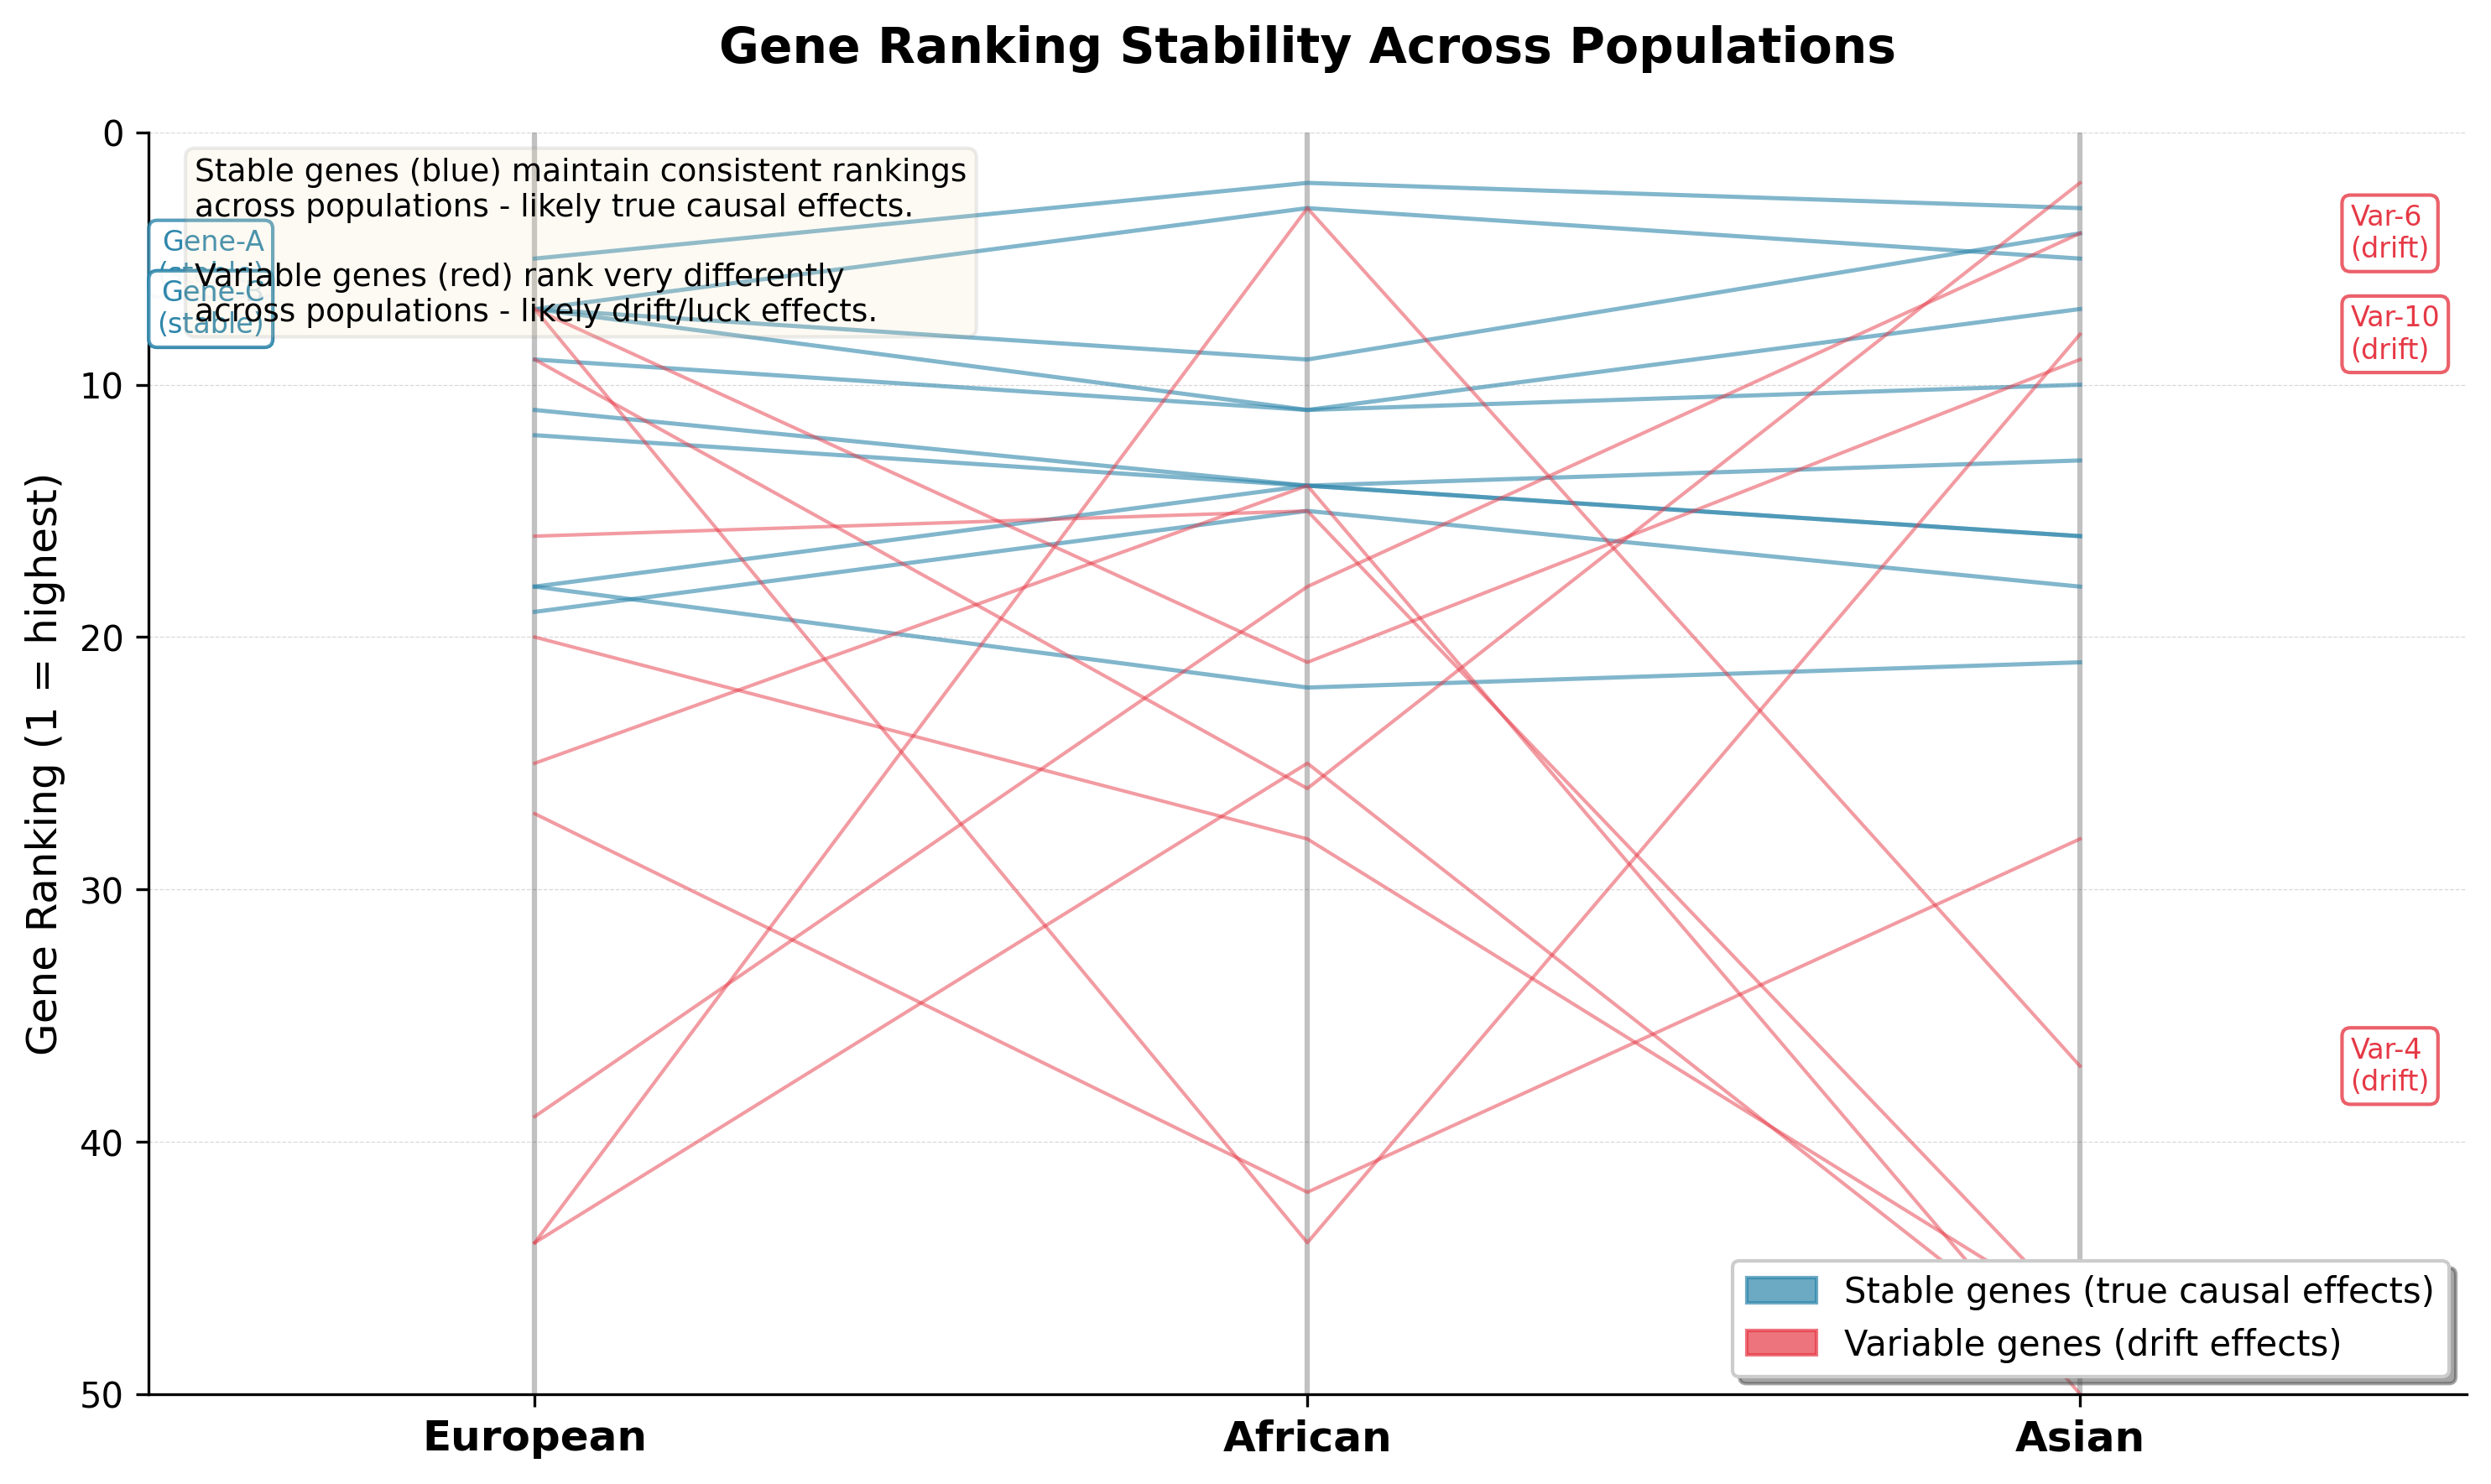 Gene ranking stability across European, African, and Asian populations. Blue lines show genes with consistent rankings across all populations (true causal effects); red lines show genes with highly variable rankings (drift/luck effects). Stability across populations is a key signal of biological validity.
Why This Matters: Drug Discovery at the Nexus
These three factors converge to shape which genes get studied, validated, and targeted for drug development.
The process looks like this:
- GWAS identifies genes ranked by association strength (length-biased, specificity-biased, luck-influenced)
- Researchers validate top-ranked genes through functional studies
- Pharmaceutical companies select these genes as drug targets
- Drugs targeting these genes enter clinical development
- Approval rates depend partly on whether the ranking was accurate
A 2020 analysis quantified the impact: drugs targeting genes with strong genetic evidence had roughly 2× higher approval probability than drugs without genetic support. Specifically, drugs targeting genes identified through GWAS show 50-55% approval rates, while drugs without genetic support show 40-45%. But here's the concerning part: GWAS-identified targets have lower approval rates than Mendelian genetics targets, which show 60-70% approval rates.
The difference comes from exactly the biases we're discussing. Mendelian genes are typically specific to their disease, with rare variant loss-of-function effects and clear mechanisms. GWAS genes are often pleiotropic common variants with unclear mechanisms.
The implication is direct: better gene ranking could improve drug discovery success rates. If we could eliminate the length bias (target genes by biological importance rather than SNP density), prioritize trait-specific over pleiotropic genes, and distinguish luck from signal, we'd choose better drug targets.
Current regulatory approval rates sit around 50-55% for drugs targeting GWAS-identified genes, versus 60-70% for Mendelian (single-gene) targets and 40-45% for genes without genetic evidence. If gene ranking improved, that approval rate could shift upward by 5-10%, which on a portfolio basis translates to completed trials, saved resources, and faster time to patients.
The Solution: Combining Multiple Methods
The good news is that the three biases aren't invisible once you know what to look for. And they're not unique to GWAS; they're systematic features of association studies that can be addressed through complementary approaches.
The 2025 Nature paper proposes a solution: integrate multiple types of genetic evidence, each correcting different biases:
GWAS + Burden tests: Use GWAS to identify pleiotropic genes (which matter broadly), and burden tests to identify specific genes (which matter narrowly for targeted therapy)
Fine-mapping: Instead of using the top associated SNP, fine-mapping identifies which variants in a region are likely causal, reducing the advantage of long genes
Expression quantitative trait loci (eQTL): Link variants to genes through functional effects rather than proximity, reducing length bias
Cross-trait analysis: Test whether a gene effect is trait-specific or pleiotropic, directly measuring the specificity dimension
Multi-ancestry replication: Validate genes across populations with different drift patterns, distinguishing luck from signal
 Source: Sayer et al., Nature (2025). Link
No single method is perfect. But combining methods addresses overlapping biases. A gene that ranks highly in GWAS, burden tests, eQTL, and cross-ancestry replication has survived multiple filters for length bias, specificity bias, and luck.
Here's a concrete example demonstrating rank aggregation in practice. The following code integrates GWAS and burden test rankings to rescue genes buried by length bias:
def aggregate_ranks(genes_df: pd.DataFrame,
                   gwas_weight: float = 0.5,
                   burden_weight: float = 0.5) -> pd.DataFrame:
    """
    Aggregate GWAS and burden test ranks using weighted average.

    By combining both methods, we can:
    - Leverage GWAS power while correcting for length bias
    - Use burden tests to identify trait-specific genes
    - Rescue important genes buried in GWAS-only analysis
    """
    # Normalize weights
    total_weight = gwas_weight + burden_weight
    gwas_weight /= total_weight
    burden_weight /= total_weight

    # Calculate weighted average of ranks (lower is better)
    genes_df['aggregated_score'] = (
        genes_df['gwas_rank'] * gwas_weight +
        genes_df['burden_rank'] * burden_weight
    )

    # Convert to final ranks
    genes_df['aggregated_rank'] = genes_df['aggregated_score'].rank(method='min')

    # Calculate rank improvement (positive = improved)
    genes_df['rank_improvement'] = genes_df['gwas_rank'] - genes_df['aggregated_rank']

    return genes_df

# Example result: Gene_0130 rescued through rank aggregation
# GWAS Rank: 492 (buried due to 2.6 kb short length)
# Burden Test Rank: 8 (detected by strong rare variant signal)
# Aggregated Rank: 149 (343-position improvement!)
The full implementation (available here) demonstrates:
- Length bias in GWAS (r=0.619 correlation with gene length)
- Minimal bias in burden tests (r=0.052)
- Weighted rank aggregation correcting for these biases
- 304 genes (30.4%) improving by >100 positions through integration
![]() Four-panel visualization showing (A) length bias in GWAS rankings, (B) reduced bias in burden test rankings, (C) before/after rank changes for top 100 genes, and (D) distribution of rank improvements across all genes. The integration systematically rescues important short genes buried in GWAS.
Four-panel visualization showing (A) length bias in GWAS rankings, (B) reduced bias in burden test rankings, (C) before/after rank changes for top 100 genes, and (D) distribution of rank improvements across all genes. The integration systematically rescues important short genes buried in GWAS.
Practical Implications: What Researchers Should Do
If you're working with GWAS data or interpreting genetic discoveries, here are actionable implications:
1. Never trust GWAS rankings alone. When a gene ranks at the top of a GWAS for a trait, ask: Is it long? If so, skepticism is warranted. Is it pleiotropic? If yes, approval rates will be lower. Did it replicate in other ancestries? If not, luck might be involved.
2. Use burden tests as a complementary filter. If a gene shows up in both GWAS and burden test results, it's more likely to be genuinely important and trait-specific. If it appears only in GWAS, genetic length might be inflating its importance.
3. Fine-map associations. Instead of attributing a signal to the closest gene (which is wrong 30% of the time), use fine-mapping to identify the likely causal variant and the gene it actually affects. Tools like SuSiE and FINEMAP reduce length bias.
4. Integrate functional evidence. eQTL data showing that a variant affects gene expression in disease-relevant tissue is evidence stronger than proximity alone.
5. Validate across populations. A gene that ranks highly in Europeans but doesn't replicate in African or Asian populations has a luck component. Ancestry-specific effects are real, but large ancestry-specific rank changes suggest drift.
6. Explicitly measure specificity. Use tools like LD score regression or multi-trait analysis to quantify whether a gene is trait-specific or pleiotropic. Include this in your prioritization algorithm, not just effect size.
This represents a shift in how we should think about genetic evidence. Instead of asking "Does this gene have the smallest p-value?" we should ask "How strong is this evidence across the dimensions that matter: effect size, specificity, replication, and functional mechanism?"
What This Means for the Future of Genetics
The recognition that gene rankings are influenced by length, specificity, and luck points toward more sophisticated approaches to gene discovery and prioritization.
We're moving from a single-axis ranking (p-value) to a multi-dimensional framework that acknowledges different types of genetic importance. A gene might be important for understanding a trait's broad biology (high trait importance, high pleiotropy), but a poor drug target because its effects are too diffuse (low trait specificity).
Future GWAS analysis will probably look quite different. Instead of publishing a single ranked list of genes, studies might report genes along multiple dimensions: trait importance, trait specificity, evidence consistency across methods, and functional mechanism. This richer reporting would help researchers and companies choose targets more thoughtfully.
For drug discovery specifically, the implications are significant. Companies investing hundreds of millions in developing drugs need to choose targets wisely. If gene ranking biases contribute to failure rates in development, correcting these biases represents an enormous value opportunity. Better ranking methods could improve approval rates, which translates to completed trials, saved resources, and faster time to patients.
But there's a deeper implication: our current understanding of genetic disease is incomplete because our discovery methods have blind spots. The genes we've studied intensively tend to be long and pleiotropic. The genes we've missed might be short, specific, and truly causal but less statistically obvious. As we apply better ranking methods, our understanding of genetic architecture will shift.
The genetics revolution of the last 15 years generated valuable insights. The next 15 years will refine our understanding by correcting for the systematic biases that shaped initial discoveries.
Further Reading
- Primary source: Sayer et al., "Specificity, length and luck drive gene rankings in association studies," Nature (2025)
- GWAS methodology: Bulik-Sullivan et al., "LD Score regression distinguishes confounding from polygenicity," Nature Genetics (2015)
- Fine-mapping: Wakefield, "Bayes factors for genome-wide association analysis," Nature Reviews Genetics (2009)
- Pleiotropy and drug approval: Richardson et al., "Evaluating the relationship between circulating lipoprotein lipids and apolipoproteins with risk of coronary heart disease," PLOS Genetics (2020)
- Tool: FUMA for gene prioritization (https://fuma.ctglab.nl/) and MAGMA for gene-based analysis